A K M ABIR
With a long-standing passion for Transportation Engineering, I have focused primarily on the area of transportation planning and travel demand modeling, realizing these are one of the few fields that require innovation and outside-the-box thinking and employ cutting-edge analytical techniques. Over the past four years, I have grown a great interest in big data analytics, machine learning, and artificial intelligence and its possible application in the transportation engineering field.
I am IBM certified in data science and have a strong background in big data analytics. I have also completed coursework in geospatial analysis, including GIS and remote sensing, and am proficient in software such as ArcGIS, TransCAD, and CUBE. I have worked on numerous projects involving the analysis and interpretation of large datasets, and am skilled at using tools such as SQL, Python, R, Power BI, and R Shiny to extract valuable insights. I have developed several tools for big data analysis and interactive visualization. Please explore my "Application Showcase" section for details.

APPLICATION SHOWCASE
I am very passionate about learning new analytical methods, software applications,s and tools. Being a transpiration engineer, I have to use a variety of datasets including speed data from INRIX and NPMRDS, transaction data from different toll roads, OD data from Bluetooth, Streetlight, and AirSage, etc. In most cases, I found that the traditional analysis software packages are not flexible and efficient enough to handle a big dataset. I have developed several interactive applications using various platforms including R, Python, and Power Query to analyze and visualize big datasets. A few of my applications are presented below.
INTERACTIVE ORIGIN-DESTINATION DATA VISUALIZATION: TRIP SUMMARY
This interactive application was developed as a part of the TRB 2017 Transportation Analytics Contest to analyze large sets of origin-destination data gleaned from wireless signaling (cell phone) data by AirSage. The application was developed using Shiny, a web application framework for the popular R package. Though this application was developed for the Orlando metropolitan region in Florida, USA, similar types of data can be analyzed using this tool.
The application analyzes data by producing graphs that show hourly distribution, user class distribution and trip purpose distribution to/from each zone. It allows the user to select a zone by clicking on the map and choosing a day type to create the graphs

DEMOEXPRESS
This is a sample dashboard based on an imaginary tollway in Atlanta to demonstrate a trend of different key matrices including average weekday transaction by vehicle type, and tag type; ETC and truck share; Hourly distribution of transactions by gantry and Origin Destination pattern observed at each gantry location.
This dynamic dashboard is developed using HTML, CSS, and JavaScript. Several open-source JavaScript libraries such as Plotly and Leaflet were used to create the interactive graphs and plots. R scripts were used to integrate all component of the dashboard.
To learn about the libraries please follow the following links:
Leaflet:Leaflet for R .
Plotly:Plotly R.

DENVER TRAFFIC DATA DASHBOARD
This application was developed using Shiny, a R-based data visualization framework. This application demonstrates an interaction between the map element and the graphic element. Please press next to learn details about this application. This application was developed using traffic and weather data in Denver, Colorado. It can be used to analyze/visualize similar datasets from other locations.
The traffic data was downloaded from http://dtdapps.coloradodot.info/otis/TrafficData
The weather data was dowloaded from https://www.wunderground.com

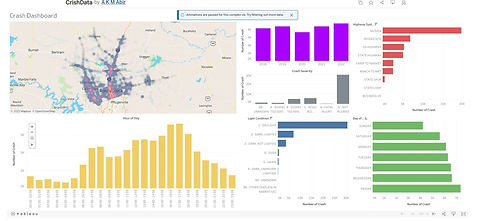
TXDOT CRIS DATA DASHBOARD
The Tableau dashboard is designed to provide an in-depth analysis of crash data from the Texas Department of Transportation's Crash Records Information System (CRIS) database specifically for Williamson County. The dashboard features a heatmap that displays the density of crashes across the county, with the intensity of the color indicating the number of crashes in a particular area.
In addition to the heatmap, the dashboard includes several graphs that show the distribution of crashes by year, crash severity, hour of day, weather condition, light condition, day of week, and highway system type for Williamson county. These graphs allow users to identify patterns and trends in the data and gain a better understanding of the factors that contribute to crashes in Williamson County.
For example, users can see how the number of crashes has changed over time by looking at the graph of crash distribution by year for Williamson County. They can also see which hours of the day and days of the week are most dangerous for driving by looking at the graphs of crash distribution by hour of day and day of week, respectively, in Williamson County. Additionally, the graphs of crash distribution by weather condition, light condition, and highway system type provide insight into the impact of these factors on crash risk in Williamson County.
Overall, this Tableau dashboard offers a comprehensive and interactive way to analyze crash data from the TxDOT's CRIS database for Williamson County, providing valuable insights to help improve road safety in the county.
WORK EXPERIENCE
TRAFFIC ENGINEER AT HDR ENGINEERING INC
June 2019 - Present
Developed procedures and tools based on SQL, Power Query, Python, and R to automate data processing and analysis
Developed demand models to forecast future traffic on proposed corridors
Built interactive dashboards and visualizations using R Shiny and Power BI to illustrate complex data
Performed cluster analysis to identify the representative day and traffic-related attributes to calibrate the simulation models
TRANSPORTATION PLANNER-3 AT CDM SMITH, AUSTIN, TEXAS
December 2015 - June 2019
Experience includes working on traffic and revenue studies for tollway projects, macroscopic and microscopic traffic models, big data analytics and managed lane studies. Extensive skills in travel demand model development, calibration and validation, network development, traffic surveys and counts, data analysis and computation. Work activities include:
Maintained and managed large databases consisting of more than 100 million toll transactions and revenue data collected on TxDOT tollways
Developed procedures and tools based on SQL, Python, and R to automate data processing and analysis
Developed demand models to forecast future traffic, transactions, and revenue on proposed tollways
Built monthly and quarterly dashboards based on R Markdown to demonstrate key metrics of transactions or revenue on the tollways
Analyzed anonymized transponder data to understand the origin-destination and travel behavior of travelers under different travel conditions
Created interactive dashboards and visualizations using R Shiny and Power BI to illustrate complex data
• Writing project reports and preparing summary tables, charts, and exhibits for inclusion in reports
GRADUATE RESEARCH ASSISTANT AT TEXAS A&M TRANSPORTATION INSTITUTE, COLLEGE STATION, TEXAS
August 2014 - August 2015
Worked very closely with Dr. Mark Burris in the project titled “Traveler's value of time and reliability as measured on Katy freeway” for one year. My work activities included:
Maintained and managed a database consisting of more than 100 million transponder reads on both general purpose lanes and managed lanes collected over three years along Katy Freeway in Houston
Conducted an extensive literature review and developed a methodology to analyze transponder data
Performed exploratory data analysis to understand the travel behavior of Katy Freeway travelers
Developed choice models using SAS software to estimate traveler value of time and value of reliability under different travel conditions
Prepared reports and presentations for both technical and non-technical audiences
Research Center, TTI
• Presenting work findings and progress reports to other team members
STUDENT WORKER AT TEXAS A&M TRANSPORTATION INSTITUTE, COLLEGE STATION, TEXAS
January 2014 - August 2014
Worked with Dr. Lubinda Walubita in the project titled “Texas flexible pavements and overlays” for six months. My work activities included:
• Conducting various tests on bituminous asphalt in laboratory
• Processing the test results using MS Access
LECTURER AT AHSANULLAH UNIVERSITY OF SCIENCE AND TECHNOLOGY,DHAKA, BANGLADESH
April 2011 - August 2013
• Instructed undergraduate level courses in Highway Design and Traffic Operations
• Supervised students in transportation engineering laboratory and computer aided design (CAD) laboratory
PROGRAMMING LANGUAGE
SQL
Python
C++
Visual Basic
STATISTICAL ANALYSIS
R
SAS
JMP
SPSS
OTHER SOFTWARE
Power BI
R Shiny
Tableau
ArcGIS
TRAFFIC ENGINEERING SOFTWARE
CUBE
TransCAD
Synchro
HCS2010
CORSIM
VISSIM
EDUCATIONAL EXPERIENCE
TEXAS A&M UNIVERSITY, COLLEGE STATION, TEXAS
2013 - 2016
Masters of Science in Civil Engineering
BANGLADESH UNIVERSITY OF ENGINEERING AND TECHNOLOGY, BANGLADESH
2006 - 2011
Bachelor of Science in Civil Engineering,
PUBLICATIONS
THE VALUE OF TRAVEL TIME AND RELIABILITY: EMPIRICAL EVIDENCE FROM KATY FREEWAY
2017
Travelers place value on both time savings and reliability when choosing a route for a trip. The value of travel time (VOT) has long been an integral part of the appraisal of transport projects. Recently, some transport planners have been incorporating the value of travel time reliability (VOR) as well. This research used data generated by automated vehicle identification sensors from Katy Freeway travelers in Houston, Texas, to estimate VOT and VOR based on revealed preferences of these travelers. Lane choice models were developed to examine the factors influencing travelers’ lane choice decisions in different traffic conditions and to estimate their VOT. Models with two independent variables—travel time and toll—resulted in an estimated VOT from $1.96 to $8.06/h for all trips on a monthly basis. The research could not conclude whether the VOR had any impact on travelers’ lane choice decisions. The percentage of managed-lane trips was higher for the those who traveled the whole length of the managed–general-purpose lanes than for those who traveled only a part of the managed–general-purpose lanes. This difference might be the result of easier accessibility at the end of the managed lanes compared with that for midpoints.
A STUDY ON MOBILITY PROBLEM OF DISABLED PEOPLE IN DHAKA CITY
2011
People with disabilities constitute a significant proportion of the poor in developing countries. Poverty, discrimination and isolation are widespread that people with disabilities continue to face. Movement accessibility is an important enabler of strategies to fight poverty through enhancing access to education, employment, and social services. Three main types of barriers were identified from the focus groups namely Social barriers, Psychological barriers and Structural barriers to accessibility. The focus of this particular study has been restrained to the structural barriers. The primary objectives are considered to find the accessibility problem for all types of disabled people and accessibility deficiencies of places they visit frequently. For this particular research the basics are three terms: disability, accessibility and movement. With distinct processes and careful observations, a picture of accessibility provisions and deficiencies at some selected places are drawn. The output of this study is mainly to focus current mobility barriers of disabled people in Dhaka city.
AWARDS
Finalist in the Transportation Research Board (TRB) 2017 transportation analytics contest: for developing an interactive web application that can utilize cellular location data in order to determine geographic extent and temporal variation of vehicular traffic in a given areaFinalist in the Transportation Research Board (TRB) 2017 transportation analytics contest: for developing an interactive web application that can utilize cellular location data in order to determine geographic extent and temporal variation of vehicular traffic in a given areaFinalist in the Transportation Research Board (TRB) 2017 transportation analytics contest: for developing an interactive web application that can utilize cellular location data in order to determine geographic extent and temporal variation of vehicular traffic in a given area
CERTIFICATION
"Don’t do what you love. Learn to love what you do – by acquiring mastery, autonomy and relatedness"
Unknown
